Tourism for all
An interactive Tableau visualization showing the geographic distribution and other attributes of the hotels taking part in the “Tourism for all 2021” program sponsored by the Greek state.
Link to Tableau Public project
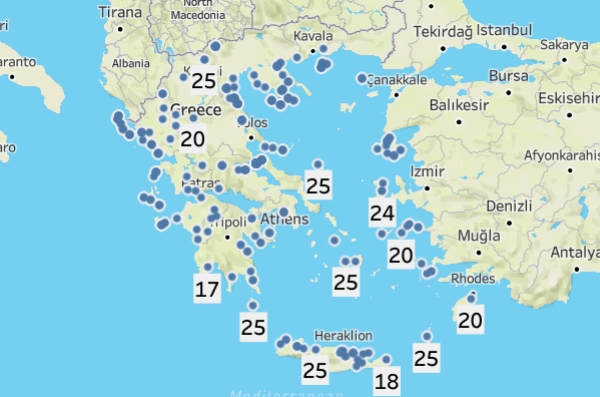
An excel sheet from the official program webpage containing location data and various attributes per residence was used. The visualization provides (among others) the name, contact number, and price per night for each hotel that satisfies certain constraints set by the user. Its design is inspired from airbnb.
Note that while Tableau Public is free and powerful, its servers are unfortunately a bit slow. It typically takes 2-3 seconds for the visualization to react to filter changes. Some patience is advised :)